Matplotlib by default does not support displaying Unicode characters such as Chinese, Japanese and Korean characters. This post introduces two different methods to allow these characters to be shown in the graphs.
The issue here is that we need to configure Matplotlib to use fonts that support the characters that we want to display. To configure the font used by Matplotlib, there are two ways.
Specifying the Path to the Font File
If you have a font file that support displaying CJK characters, you can directly provide the path to the font file using the FontProperties class in Matplotlib. This font file can be a .ttf file (TrueType Font) or a .otf file (OpenType Font). For example, you can download a OTF font that supports displaying CJK characters from Google Fonts.
Once we have the font file, we can create a FontProperties instance as follows:
import matplotlib.font_manager as fm
fprop = fm.FontProperties(fname='NotoSansCJKtc-Regular.otf')
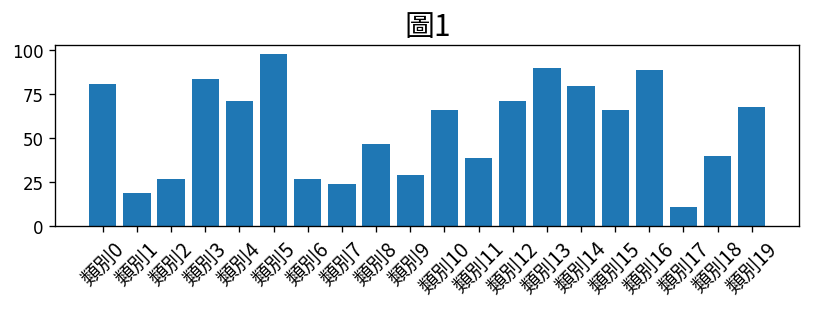
When plotting a graph, we can provide this FonProperties instance as an argument to functions that control what words are displayed in the graph. The example below shows how to set the font for the title and the labels on the X-axis.
import matplotlib.pyplot as plt

# Prepare some data
x = list(range(20))
xticks = ["類別{:d}".format(i) for i in x]
y = [random.randint(10,99) for i in x]

# Plot the graph
plt.figure(figsize=(8, 2))
plt.bar(x, y)
plt.xticks(x, xticks, fontproperties=fprop, fontsize=12, rotation=45)
plt.title("圖1", fontproperties=fprop, fontsize=18)
plt.show()
The effect will be as follows:
Using Fonts in the Font Folder
Another way of using a custom font is to install the font into Matplotlib’s font folder, and update the font manager.
Firstly, we need to know the path to the font folder. We can first use the following command to check the location of the Matplotlib installation:
print(matplotlib.matplotlib_fname())
On my computer the above command will print:
/usr/local/lib/python3.7/site-packages/matplotlib/mpl-data/matplotlibrc
The full path to the font folder can be obtained by replacing /mpl-data/matplotlibrc with /mpl-data/fonts/ttf:
/usr/local/lib/python3.7/site-packages/matplotlib/mpl-data/fonts/ttf
Next, you can put the font file you would like to use into the font folder, and then update Matplotlib’s font manager:
import matplotlib.font_manager as fm
fm._rebuild()
Once this is done, you can check the name of the font you have installed using the following statement. In this example, I have downloaded the font NotoSansCJKtc-Regular.otf from Google Font, and placed it in the file folder.
[f for f in fm.fontManager.ttflist if 'Noto' in f.name]
And the following is the output:
[<Font 'Noto Sans CJK TC' (NotoSansCJKtc-Regular.otf) normal normal 400 normal>,
 <Font 'Noto Sans Tagalog' (NotoSansTagalog-Regular.ttf) normal normal 400 normal>,
 <Font 'Noto Sans Kayah Li' (NotoSansKayahLi-Regular.ttf) normal normal 400 normal>,
 <Font 'Noto Sans Tai Tham' (NotoSansTaiTham-Regular.ttf) normal normal 400 normal>,
 <Font 'Noto Sans Ol Chiki' (NotoSansOlChiki-Regular.ttf) normal normal 400 normal>,
 ...
Here, the name of the font is “Noto Sans CJK TC”. We can then configure Matplotlib to use this font in our graphs:
matplotlib.rcParams['font.family'] = ['Noto Sans CJK TC']
Below is an example:
plt.figure(figsize=(8, 2))
plt.bar(x, y)
plt.xticks(x, xticks, fontsize=12, rotation=45)
plt.title("圖1", fontsize=18)
plt.show()
which will produce the same graph as above:
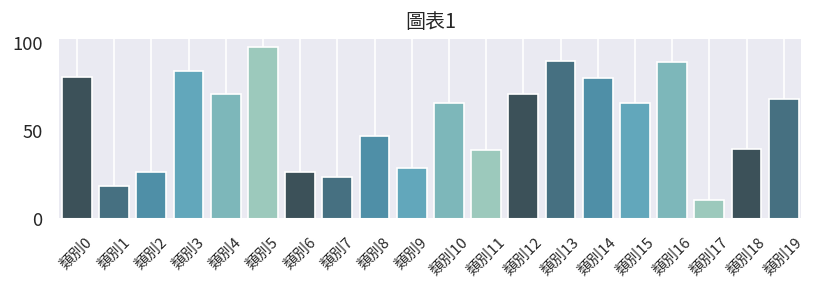
Using Custom Fonts in Seaborn
Choosing the second method described above allowing you to use the font in Seaborn too. Below is an example that shows how you can configure the font to be used in Seaborn.
import seaborn as sns
colour = sns.color_palette("GnBu_d")
sns.set(rc={'figure.figsize':(8, 2), 'figure.dpi':120})
sns.set(font='Noto Sans CJK TC')
ax = sns.barplot(xticks, y, palette=colour)
ax.set_xticklabels(xticks, rotation=45, fontsize=9)
ax.set_title("圖表1")
ax.grid()
And the following graph will be produced: